
CRYPTO
Ethereum’s Scaling Success Is Starving Ether Holders
Ethereum’s layer-2 fees are 229 times cheaper, yet ether’s burn no longer offsets new issuance, recasting the 2026 ETH investment case.

Ethereum’s median layer-2 fee sat at 0.09 cents in August 2026, 229 times cheaper than February 2024. Ether still trades as the second-largest crypto, near $2,487 on September 13, 2026, with a burn that no longer offsets new issuance.
More usage was supposed to destroy more ETH. The usage arrived on rollups that pay almost nothing to the base layer, which is why “is Ethereum a good investment” now turns on who keeps the cash.
The Burn That Scaling Turned Off
London’s fee burn still works the same way it did in August 2021. Every base fee is destroyed. The how The Merge changed ETH issuance write-up still shows execution-layer issuance at zero after September 2022, with new ETH coming only from staking rewards, an 88.7 percent cut from the old proof-of-work pace.
That cut made the ultrasound-money claim true for a while. From the Merge through Dencun in March 2024, burns beat new coins and supply slipped by about 450,000 ETH from the Merge-day stock of about 120,520,000. Then blobs moved rollup data off expensive calldata. Daily burns that once ran in the thousands fell to tens of ETH on quiet days.
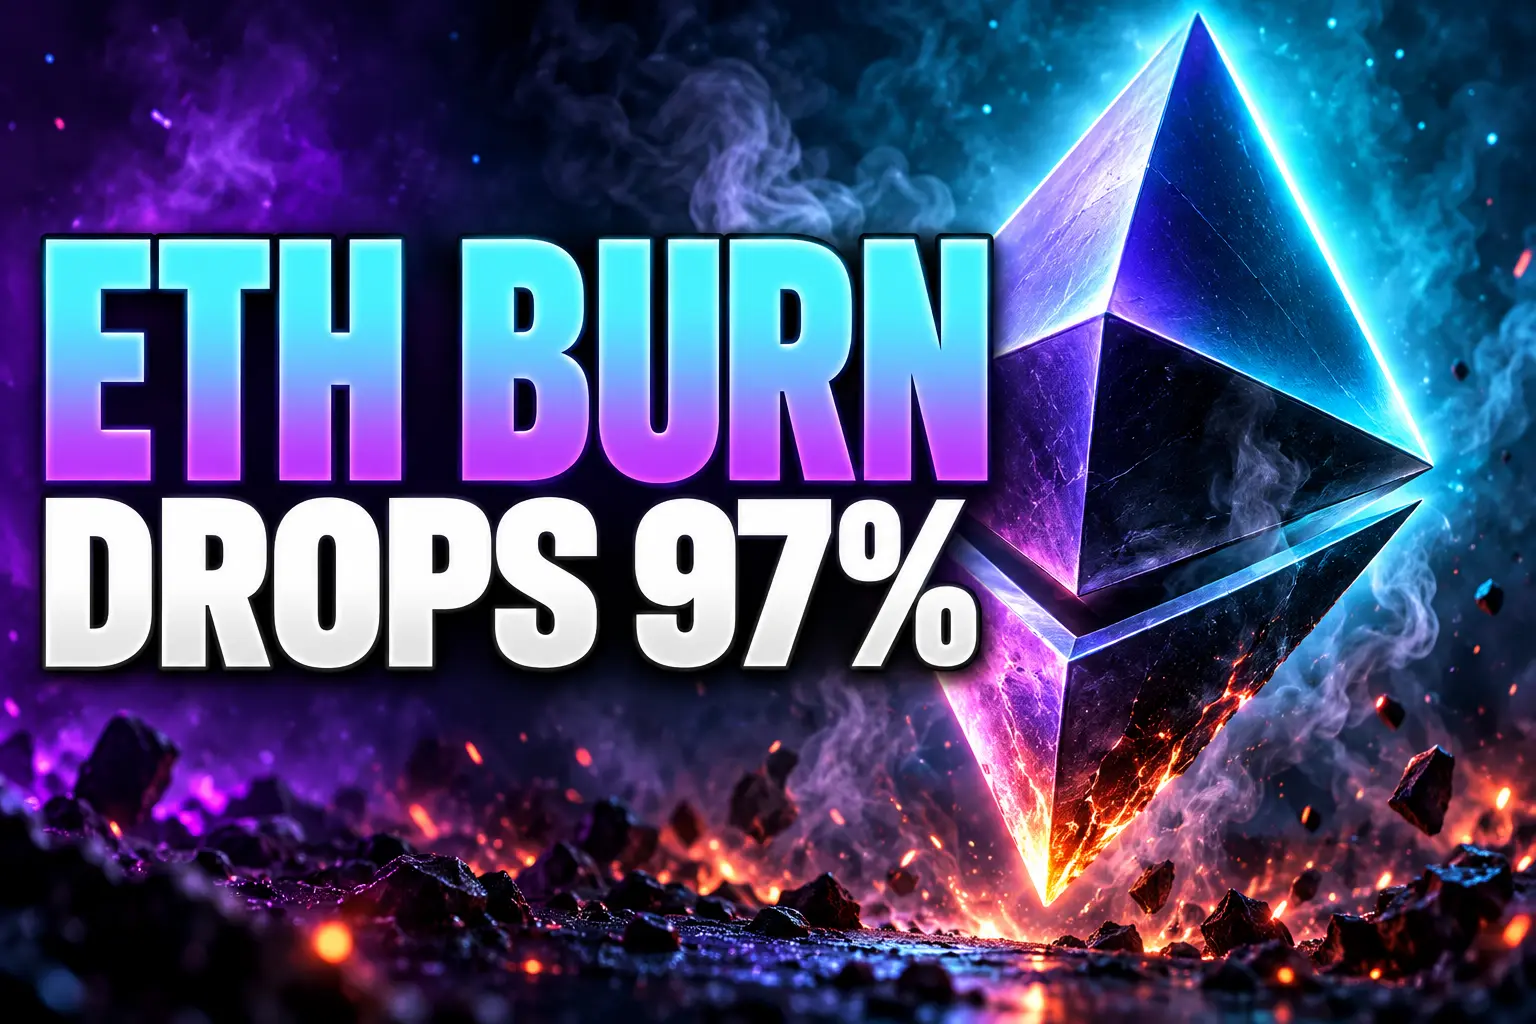
A 30-day window on the live ETH supply and burn dashboard ending around September 2, 2026, showed 1,160.53 ETH burned against about 87,700 ETH issued, a 0.86 percent annualized add. Average post-Merge burn was about 1,391 ETH a day. Recent days were near 38.7 ETH, a 97 percent drop. The live page on September 13, 2026, printed a 0.1 gwei base fee against 13.384 gwei that would have been needed, in that earlier window, to hold supply flat. About 4.6 million ETH has been burned since 2021. The circulating stock is still 122,039,177 ETH, 1,519,177 above the Merge.
ETH SUPPLY BY ERA
| Period | Supply path | What changed |
|---|---|---|
| Merge to Dencun | Down about 450,000 ETH | Issuance cut 88.7 percent; L1 fees still fat |
| After March 13, 2024 | Growing again | Blobs cheapened L2 data; burn collapsed |
| 30 days to early September 2026 | +0.86 percent annualized | 1,160.53 ETH burned vs about 87,700 issued |
Pre-Merge issuance ran near 4.61 percent a year. After the Merge, with 14 million ETH staked, the docs put consensus issuance near 0.52 percent. Stake is much higher now, so gross issuance is higher too, and the burn no longer covers it.
Ether Fell 65 Percent After a 236 Percent Rally
The last cycle still has the same shape as earlier ones, only with a milder low. Ether’s close on April 8, 2025, was $1,473. On August 24, 2025, it printed an all-time high of $4,954, a 236 percent rise from that April close.
THE 2025-2026 PRICE PATH
- April 8, 2025: Closes at $1,473, the cycle low on daily closes.
- August 24, 2025: Hits $4,954, a new record.
- February 6, 2026: Trades near $1,755 in a leverage unwind, about 65 percent below the high.
- June 25, 2026: Closes at $1,565, 68 percent below the high.
- September 13, 2026: Trades near $2,487, 49.8 percent below the high, market cap about $304 billion.
Double-digit weekly swings never left. What changed is the story attached to them. The 2025 run coincided with spot ether ETFs, the Pectra upgrade, and a legal path for dollar coins. The slide that followed was steeper than bitcoin’s, and it arrived while on-chain dollar balances kept growing. That is Ethereum’s price lag as finance infrastructure in one chart: the rails filled up, the token did not.
Ethereum Still Hosts Nearly Half of All Stablecoins
If you judge the chain by dollars parked on it, Ethereum is still the main venue. Stablecoin Beat’s network table on September 13, 2026, put 48.46 percent of stablecoin supply on Ethereum, or $148.4 billion of $306.2 billion covered ($303.0 billion on the site’s canonical total). Tron held $94.2 billion. Solana held $16.4 billion. Base, an Ethereum rollup, held $5.0 billion more.
STABLECOIN SUPPLY BY NETWORK
| Network | Supply | Share |
|---|---|---|
| Ethereum | $148.4 billion | 48.46 percent |
| Tron | $94.2 billion | 30.77 percent |
| BNB Chain | $16.9 billion | 5.52 percent |
| Solana | $16.4 billion | 5.36 percent |
| Base (L2) | $5.0 billion | 1.63 percent |
Those balances are working. Visa’s adjusted stablecoin volume hit $1.79 trillion in June 2026. The first half of 2026 already totaled $8.82 trillion, above the $5.8 trillion recorded for all of 2024. Token Terminal’s September 13, 2026, real-world asset tap, which is a different pile from dollar coins, still gave Ethereum $23.0 billion of a $46.4 billion market, or 49.6 percent. Fintechs that want dollar balances on-chain still land on Ethereum settlement, including the stablecoin payment rails for Figure and Chime.
The holder problem is that a USDT transfer can clear on a rollup for a fraction of a cent and leave almost no burnt ETH behind. The dollar is the product. Ether is the security budget sitting underneath it.
Who Captures the Fees After Fusaka?
Growthepie’s cross-rollup series, refreshed September 13, 2026, puts the median L2 fee 229 times cheaper than February 2024, a 99.6 percent drop. Dencun on March 13, 2024, did most of the work, taking the median from 20 cents to 1.9 cents. Pectra on May 7, 2025, doubled the blob target. Fusaka on December 4, 2025, added PeerDAS and a blob-fee floor, then BPO forks lifted the target to 14 blobs per block by January 2026.
WHAT FUSAKA CHANGED FOR HOLDERS
- User fees: The August 2026 median was 0.09 cents, versus 0.11 cents in August 2025.
- Blob floor: EIP-7918 stops blobs from trading at 1 wei when demand is slack.
- Counterfactual cash: Fidelity Digital Assets modeled the floor as if it had run since Dencun through October 28, 2025, and got an extra $78,646,739, or 24,641 ETH, on 93 percent of days.
- Who pays: That is about $6.02 per blob, taken from rollup margins or from users.
Max Wadington’s Fidelity note put Base’s last-year blob bill at $5.2 million against about $94 million in user fees. The same $78.6 million blob-fee model implied Base would owe about $30.6 million extra in a year at 580 blobs an hour.
Does Ethereum have the liquidity and network effects to overcome the additional costs put on Layer 2 platforms and their users, or are they increasingly being driven to a more cost-effective DA option?
Max Wadington, Fidelity Digital Assets
The louder problem for ETH is not empty blocks. Rollup sequencers keep execution fees and most MEV. In August 2026, Base’s parent was selling those ETH fees and adding bitcoin, while its ether holdings stayed roughly flat. Alignment is now a cash-flow choice, not a slogan. Cheap data was the point of the roadmap. Cheap data is also why L1 revenue fell off a cliff.
43 Million ETH Is Locked in Staking
The supply sink that still works is staking, not the burn. Ultrasound’s beacon-chain balance on September 13, 2026, was 43,318,126 ETH, 35.5 percent of 122,039,177. Leon Waidmann, head of business development at Lisk, called that an all-time high the same day.
STAKING SNAPSHOT, MID-SEPTEMBER 2026
- Active validators: 910,383 on beaconcha.in around September 11, 2026.
- Lido share: 8.39 million ETH, 19.38 percent of stake, across 261,745 validators, with a 2.63 percent 30-day APR.
- Entry queue: 1,831,676 ETH waiting about 31 days 19 hours; the exit queue was empty.
- Count vs stake: June 15, 2026, showed about 1,239,795 validators and 39.6 million ETH staked, before consolidations shrank the headcount while locked ETH rose.
Pectra let operators fold 32 ETH validators into larger ones, so “more validators” is a worse decentralization proxy than it was in spring. Lido’s slice of stake is the figure that still bites. Yield near 2.6 percent is a bond coupon, not a growth kicker, and it is paid by issuing the same ETH the burn no longer deletes.
Solana Took the DEX Tape This Year
On trading, Ethereum is no longer the default. Galaxy Research had Solana as the top chain for DEX volume for a fifth straight quarter in Q1 2026, with share near 31 percent. Mid-September on-chain tallies still showed Solana’s 30-day DEX volume well above Ethereum L1. Uniswap itself said it did $70.6 billion in 30-day trades as of September 12, 2026, with Robinhood Chain ahead of Ethereum L1 inside that total.
That split fits the fee math. High-frequency swaps want sub-cent, sub-second rails. Solana sells that as a single chain. Ethereum sells it as a bundle of rollups that fragment liquidity and send almost no gas back to L1. Large stablecoin tickets and tokenized funds still prefer Ethereum’s depth. The tape, the memecoin flow, and a lot of retail order flow do not.
Hayden Adams, who founded Uniswap, put the investment riddle in one line in June 2026: who is the marginal buyer of ETH if the chain wins as finance plumbing.
“Who is the marginal buyer of ETH”
If Ethereum wins as financial infrastructure, with adoption tied to fees/eth burn, the largest institutions building on top will view the ability to own a piece as a huge plus
Permissionless to use, build on, and buy in
(Uniswap is similar)
— Hayden Adams 🦄 (@haydenzadams) June 16, 2026
What a Buyer of Ether Is Underwriting
A buyer of ETH in September 2026 is not underwriting a scarce ultrasound float. They are underwriting a settlement and collateral asset whose cash engine is running cold, with a 35.5 percent staking lock and a still-large dollar float as the offsets.
WHAT WE KNOW
- The burn: Issuance beats destruction in normal 2026 traffic, with recent 30-day net supply up 0.86 percent a year.
- The float: Ethereum still holds $148.4 billion of stablecoins and 49.6 percent of the tracked RWA book.
- The queue: 1,831,676 ETH is waiting to stake, and the exit queue is at 0 ETH.
WHAT IS UNCONFIRMED
- Blob pricing power: Whether EIP-7918 and later blob targets restore meaningful L1 revenue without pushing rollups to other data layers.
- Based rollups: Whether validator-run sequencing returns MEV to ETH holders in size.
- The ETF bid: Whether spot ether funds remain a durable buyer after the 2025-2026 drawdown.
Crypto remains uninsured by the FDIC or SIPC, and protocol upgrades can move the price before anyone knows if the fee math improved. Ether is still a high-vol bet on a chain that won the dollar and then gave the fees away. The 1.83 million ETH still trying to get into the validator set is the clearest bid on that bet, and it is sitting in a 32-day line while the burn stays cold.
Disclaimer: This article is news reporting and analysis of public market and on-chain data, and it is informational only. It is not investment advice, a solicitation to buy or sell ether or any other crypto asset, or a recommendation of any staking, ETF, or DeFi product. Readers should consult a licensed financial adviser who understands crypto custody, tax, and volatility before acting. Prices, supply, validator counts, and fee figures reflect the cited dashboards and research as of the dates named above and can change with the next block.

Instagram Plus Tests a Read-Only Mode That Cuts Stories

Altman Asks the Public to Accept Some AI Harm

Google Freezes OSS VRP Product Reports After AI Flood

AI Agents Make Payment Rails the Scarce Prize

Turkey’s Crypto Boom Now Runs Through Three Banks

Fable 5 Came Back Under a Commerce On-Off Switch

Google’s SpaceX GPU Lease Has a Sept. 30 Deadline

Plasma One’s XPL Locks Face a 1.81 Billion Cliff

DGO’s Rs 549 World Cup Pass Cost Fans Sleep and Data

Moonshot AI’s $30 Billion Ask Became a $35 Billion Close
-
 AI4 months ago
Fable 5 Came Back Under a Commerce On-Off Switch
-
 AI4 months ago
Google’s SpaceX GPU Lease Has a Sept. 30 Deadline
-
 CRYPTO4 months ago
Plasma One’s XPL Locks Face a 1.81 Billion Cliff
-
 APPS4 months ago
DGO’s Rs 549 World Cup Pass Cost Fans Sleep and Data
-
 AI4 months ago
Moonshot AI’s $30 Billion Ask Became a $35 Billion Close
-

 NEWS4 months ago
ColorOS 17 Device List Spans Oppo, OnePlus and Realme
-

 GAMING4 months ago
Xbox Cuts 3,200 Jobs After Five Years of Thin Returns
-
 GAMING4 months ago
The RTX 4050 Under Rs 70,000 Hides a Wattage Gap