CRYPTO
Bitcoin and Ether Climb as $221.7M Spot ETF Inflow Breaks Streak
A $221.7M spot Bitcoin ETF inflow broke a 10-day outflow streak on July 2, pulling BTC toward $63,000 on July 3 while Ether pushed to $1,775 and Extreme Fear held.
Bitcoin pushed back toward $63,000 on July 3, 2026, recovering from a 21-month low it had set earlier in the week, with Ether outpacing the broader market to reach $1,775. The move tracked a single session of fresh demand from regulated US funds: spot Bitcoin ETFs took in a net $221.7 million on July 2, the largest one-day haul since early May and the first positive session after 10 straight days of outflows, per SoSoValue.
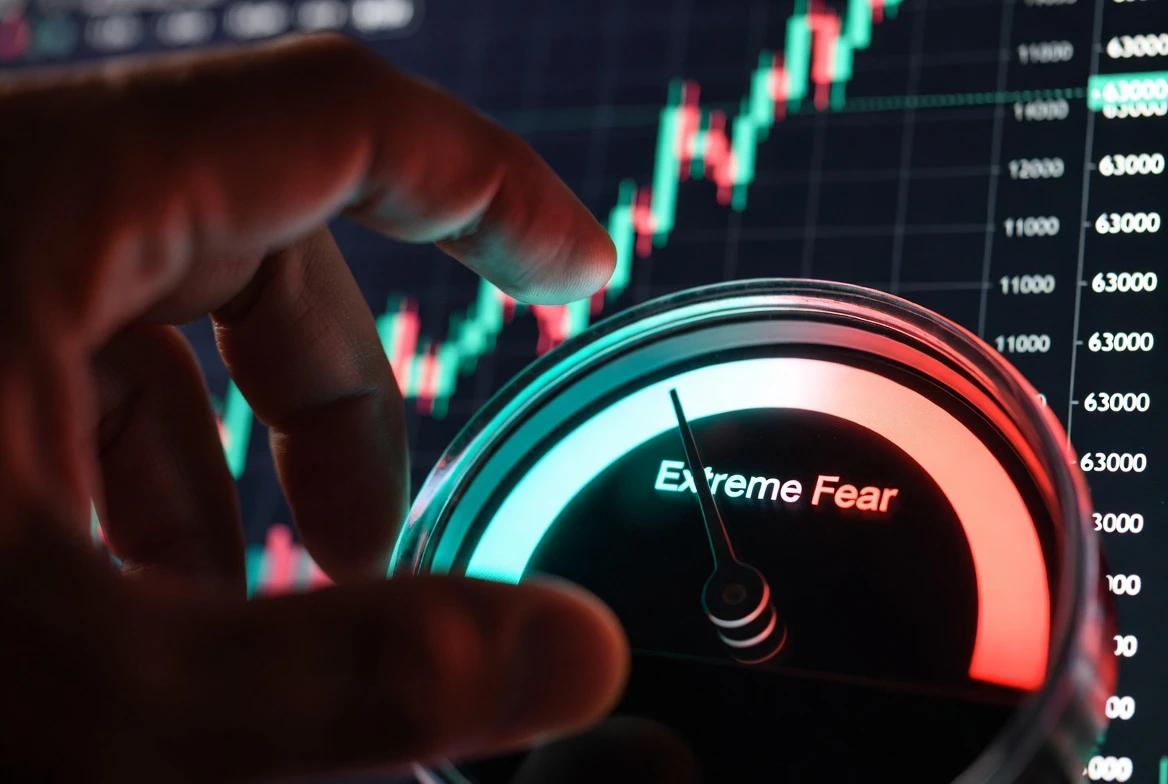
Yet the rebound landed against a sentiment backdrop that has rarely been darker. The Crypto Fear & Greed Index sat at 11 out of 100, deep in “Extreme Fear,” even as Bitcoin funding rates stayed positive for eight consecutive days and leveraged positions quietly built up into a thin US holiday weekend.
BTC Closes In on $63,000 and Ether Pushes to $1,775
Bitcoin climbed to within $50 of $63,000 on July 3, recovering most of a drawdown that had taken the asset to a 21-month low days earlier, while Ether outperformed the wider market to reach $1,775. The earlier drop had also pushed ETH to a fresh year-to-date low, per the same reporting.
The advance stretched across the board. A live tape at 21:46 UTC on July 3 showed BTC at $62,655 (up 1.90% on the session), ETH at $1,756 (up 3.43%), and breadth positive across 17 of 17 listed names, with Cardano up 10.85% and NEAR up 5.64%.
| Coin | Price on July 3 (US$) | Daily change |
|---|---|---|
| Bitcoin (BTC) | 62,655 | +1.90% |
| Ethereum (ETH) | 1,756 | +3.43% |
| Solana (SOL) | 82.40 | +2.18% |
| XRP | 1.14 | +4.78% |
| Cardano (ADA) | 0.18 | +10.85% |
Where the $221.7 Million ETF Inflow Came From
On July 2, US spot Bitcoin ETFs recorded net inflows of $221.7 million, the largest single-day figure since early May and the first positive session after 10 consecutive days of outflows, according to the live US spot Bitcoin ETF tracker. SoSoValue’s ETF dashboard put the precise daily figure at $221.72 million.
That single session does more than interrupt a losing streak. Spot ETF flows act as a steady channel of fresh spot demand for the underlying asset, and a sharp day of inflows tends to drag spot prices higher with it. When outflows run, as they did for 10 sessions leading into July 2, that channel pushes the other way.
The reversal also arrived against an unusually cautious institutional backdrop. As covered in ETF-driven slide below $60,000 for Bitcoin, US spot funds had bled for six weeks before this week, the dollar had strengthened, and the Federal Reserve’s hawkish turn had weighed on price. One tally puts cumulative US Bitcoin ETF outflows through June near $4.5 billion, with at least one major bank trimming its year-ahead Bitcoin target to $82,000 from $112,000.
- US spot Bitcoin ETF net inflow on July 2: $221.7 million (SoSoValue)
- Consecutive outflow days ended: 10
- First inflow session since: early May
- Cumulative US Bitcoin ETF outflows through June: roughly $4.5 billion
- Crypto Fear & Greed Index on July 3: 11 (“Extreme Fear”)
The harder question is whether July 2 is the start of a sustained bid or a one-day pocket. A rebound framed by extreme fear and rising leverage tends to be more fragile than one built on calmer positioning.
A Soft Jobs Print and a Friendlier Fed Read Drive the Tape
The ETF inflow did not arrive in a vacuum. A soft June jobs report, showing far fewer new positions than expected, gave the Federal Reserve less reason to keep policy tight, and softer remarks from Fed officials cooled fears of another rate rise. The odds of a further US rate increase in 2026 dropped to about 47% from 54% the day before, per the underlying rate data.
Crypto carries no yield of its own, so its appeal shifts with the cost of holding cash. As rate-rise odds fell, traders unwound bearish bets. More than $300 million in shorts against crypto were forced to close as prices climbed, accelerating the early part of the move. The same dynamic bled into smaller coins: Ethereum jumped about 6.03% intraday on July 2, Solana and XRP each rose around 4%, and a smaller coin like Cardano added close to 6.93%.
Leverage Is Building Without Much Price Progress
Funding rates, the periodic payments long traders make to shorts when the market leans bullish, have stayed positive for the past eight days and have climbed through the stretch. Open interest, the notional size of outstanding leveraged Bitcoin positions, is near its highest level in the past several days, even as price has mostly moved sideways. Both signals come from the Bitcoin funding and open interest dashboard.
Funding has stayed positive for the past eight days and has been climbing throughout this period.
Leverage building up without price making much progress is generally viewed as a caution sign rather than confirmation that a rally is underway. If the market fails to push higher soon, those leveraged longs can become vulnerable to liquidation cascades, turning a choppy tape into a fast reversal. The derivatives market is confirming real interest on the long side, and it is also raising the stakes if follow-through does not arrive quickly.
Two Levels to Watch Into the Holiday Weekend
The first is support near $61,000. A large cluster of leveraged buy positions sits around that zone, which can either absorb weakness if buyers defend or trigger stop-and-liquidation activity if it breaks. The second is resistance above $62,500. A move back through that line would put Bitcoin within reach of prices where leveraged shorts become more exposed.
- $61,000: leveraged long cluster, primary downside magnet
- $62,500: line that puts more leveraged shorts at risk
- Thin holiday-weekend tape: liquidity drops, moves can overshoot
- Crypto Fear & Greed Index: still at 11, deep in “Extreme Fear”
Traders also keep one eye on PlanB’s case for a $52,000 realized-price bear floor, the level that the analyst points to as the real test of whether the multi-month drawdown has run its course.
Frequently Asked Questions
How much did spot Bitcoin ETFs take in on July 2, 2026?
US spot Bitcoin ETFs recorded net inflows of $221.7 million on July 2, 2026, per SoSoValue’s ETF dashboard. That was the largest single-day inflow since early May and the first positive session after 10 consecutive days of outflows.
Why is Bitcoin climbing when the Fear & Greed Index reads “Extreme Fear”?
Price and sentiment can diverge for stretches. The July 2 ETF inflow, the soft June jobs report, and softer Federal Reserve remarks dragged the odds of another US rate increase from 54% to 47% in a single session, and that rotation lifted prices even though the Alternative.me index still read 11 out of 100.
What does positive funding for eight straight days mean for Bitcoin right now?
Persistent positive funding means longs are paying shorts each interval, a sign that the market is leaning toward higher prices. Eight days of climbing funding, combined with open interest near recent highs while price mostly moves sideways, is read by many desks as a setup for faster reversals if the market fails to extend higher.
Which price levels matter most for BTC into the holiday weekend?
The cluster around $61,000, where leveraged long positions concentrate, is the support to watch. The line above $62,500 is the resistance to watch; a clean break there would put more leveraged short positions at risk and could amplify a follow-through move in either direction on the thinner holiday tape.
What risk does the current setup carry for leveraged traders?
Crowded long positioning into a thin, fear-driven tape can liquidate quickly if price fails to extend. Bitcoin still trades down roughly 42% on a 12-month basis, June’s US Bitcoin-fund outflows came to about $4.5 billion, and the Fear & Greed Index has spent most of 2026 in “Extreme Fear” – the next few sessions will reveal whether buyers defend $61,000 or the setup unwinds.
Disclaimer: The information above is provided for general informational purposes only and does not constitute financial or investment advice. Digital assets are volatile; figures are accurate as of the publication date and may change without notice. Consult a qualified professional before making any investment decision.

Samsung’s Design Chief Molds the Fold8 Like a Passport

Qualcomm Stretches Snapdragon 8 Elite Gen 5 as Chip Costs Climb

Thailand and the Philippines Force Crypto Exchanges to Hunt Scammers

WhatsApp Adds Adobe-Powered PDF Tools and Hands-Free Car Mode

Samsung’s Smart Glasses Replay Android’s Old Playbook Against Meta

Xbox Backward Compatibility Hits PC After Microsoft Called It Done

A New Nautilus Extension Restores GNOME’s Lost Computer View

Bezos’s Prime Video AI Overhaul Puts Studio Deals at Risk

Samsung’s PCIe 6.0 AI SSD Arrives Five Months Behind Micron

Coinbase Grows Singapore Staff to 200 After Global Cuts

Fable 5 and Mythos 5 Return as US Lifts Anthropic Export Controls

SpaceX’s Google Deal Turns a Rocket Company Into a Cloud Landlord

CD Projekt Red Co-CEO: Redemption Arc Isn’t Done, Witcher 4 in 2027

DGO App Brings Rs 549 Mobile Pass for FIFA World Cup 2026 in Nepal

XPL Rallies 30% Ahead of Plasma One Card Tier Launch

Oracle Cuts 21,000 Jobs in a Year, Cites AI in 10-K Filing

Google Search Profiles Build a Follow Graph Inside Discover

Moonshot AI Targets $30 Billion in China’s Fastest AI Funding Sprint

Microsoft Xbox Layoffs Start in July as Sharma Slams 3% Margin

WhatsApp Meta Business Agent Reaches India, With a New Pricing Meter
-
 AI4 weeks ago
Fable 5 and Mythos 5 Return as US Lifts Anthropic Export Controls
-
 AI2 months ago
SpaceX’s Google Deal Turns a Rocket Company Into a Cloud Landlord
-
 GAMING1 month ago
CD Projekt Red Co-CEO: Redemption Arc Isn’t Done, Witcher 4 in 2027
-
 APPS2 months ago
DGO App Brings Rs 549 Mobile Pass for FIFA World Cup 2026 in Nepal
-
 CRYPTO1 month ago
XPL Rallies 30% Ahead of Plasma One Card Tier Launch
-
 AI1 month ago
Oracle Cuts 21,000 Jobs in a Year, Cites AI in 10-K Filing
-
 NEWS2 months ago
Google Search Profiles Build a Follow Graph Inside Discover
-
 AI2 months ago
Moonshot AI Targets $30 Billion in China’s Fastest AI Funding Sprint