
AI
Surrey AI Maps Three Heart Attack Paths and Their Molecular Roots
University of Surrey AI clusters 12,701 UK Biobank heart attack survivors into three paths with distinct genetics.

An explainable AI model trained on UK Biobank records has sorted 12,701 heart attack survivors into three multimorbidity trajectories that can be predicted from data available at the time of the event itself. The work, published in the Journal of the American Medical Informatics Association, also ties each path to distinct molecular pathways, giving clinicians a “why” that standard risk scores do not.
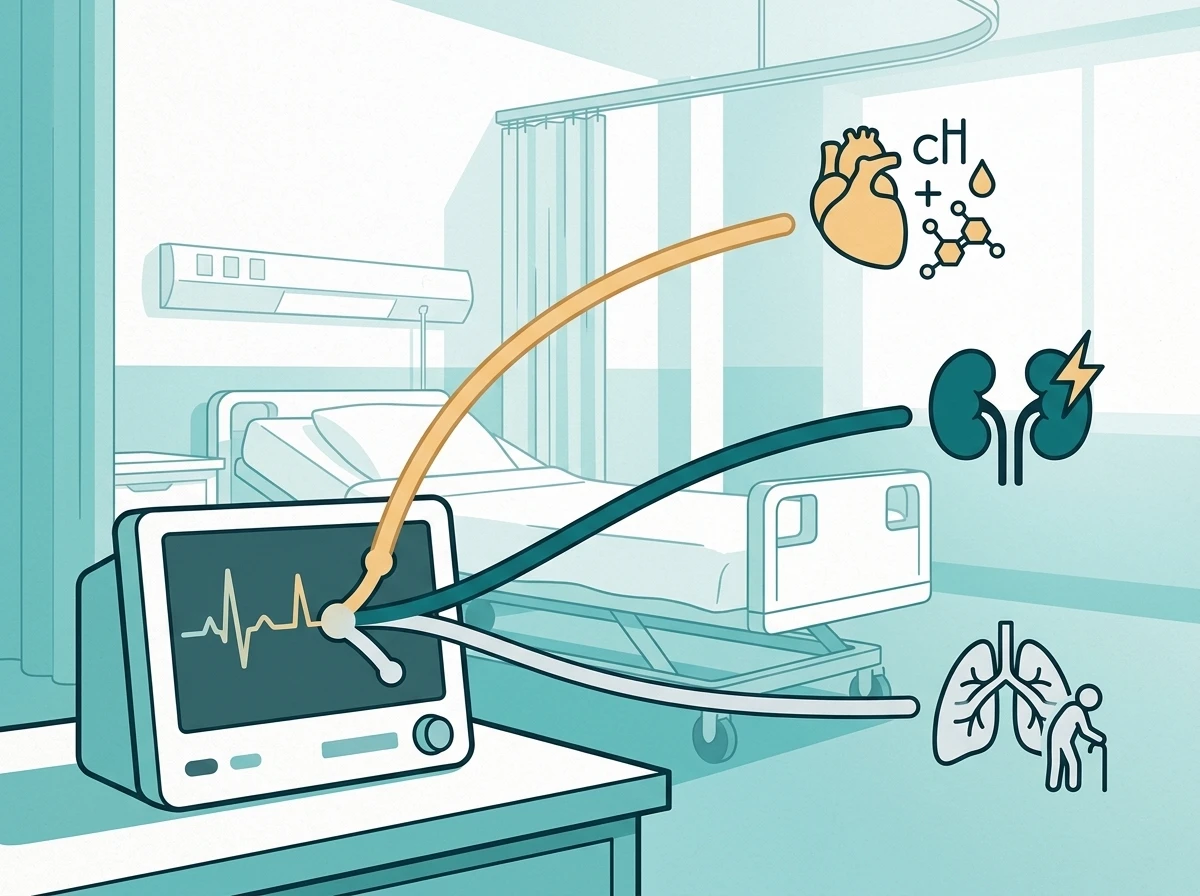
The largest group, labelled ACUTE-CARD, made up 63.4 percent of the cohort and showed mainly cardiometabolic conditions with episodic heart and respiratory issues. A smoking-related cluster (SMO-CARD, 23.1 percent) carried a five-year mortality rate of 43.9 percent. The remaining 13.5 percent (CARDIOMIX) developed structural heart disease, arrhythmias and kidney problems.
Three Trajectories After the Event
Researchers from the University of Surrey applied Dynamic Time Warping k-means clustering to the sequence and timing of new ICD-10 diagnoses in the five years after acute myocardial infarction. Topic modelling then labelled the clusters by dominant themes.
| Trajectory | Share of cohort | 5-year mortality | Dominant features |
|---|---|---|---|
| ACUTE-CARD | 63.4% | lowest | Cardiometabolic disease, episodic cardiorenal-respiratory events |
| CARDIOMIX | 13.5% | intermediate | Arrhythmias, structural heart disease, kidney involvement |
| SMO-CARD | 23.1% | 43.9% | Respiratory decline, musculoskeletal problems, multisystem smoking-related damage |
Dr Anthony Onoja, lead author and Research Fellow at Surrey, noted that the smoking-related group’s mortality was more than three times that of the largest cluster. News-Medical coverage of the university release and Onoja’s own summary both put the figure near 44 percent.
Prediction Works From Pre-Event Records Alone
Classifiers trained only on diagnoses recorded in the year before the heart attack plus simple demographics (age, sex, deprivation score, BMI) could assign patients to the correct future trajectory with high discrimination. XGBoost reached an AUC-ROC of 0.906 (95 percent CI 0.895-0.916); CatBoost was nearly identical at 0.900.
SHAP interpretability highlighted the features that drove the highest-risk assignment:
- Pre-existing respiratory conditions
- Older age
- Higher Index of Multiple Deprivation scores
- Smoking-related diagnostic codes already present
Onoja said the models were “incredibly effective at finding and predicting the highest-risk group.” The same pre-event data that hospitals already hold can therefore flag the path before most of the later diagnoses appear. The full JAMIA study on multimorbidity trajectories supplies the exact performance tables and SHAP rankings.
SMART Still Predicts Death Best, Trajectories Explain Why
Clinicians already rely on tools such as the SMART risk score for recurrent vascular events, which estimates 10-year risk of myocardial infarction, stroke or vascular death from age, smoking, blood pressure, lipids, eGFR, CRP and prior vascular beds. In the Surrey analysis the SMART score remained the strongest single predictor of five-year mortality.
Clinicians typically use risk assessments, such as the SMART score, to help them understand how likely a patient is to have another heart event. We found that these tools are still the strongest single predictor of mortality in our study, but the trajectories added detail that a stand-alone score cannot provide. The patterns we have identified show that we can capture more than just a patient’s risk but, crucially, why, and where intervention could be needed.
Professor Nophar Geifman, senior author, University of Surrey
After full adjustment the trajectory associations with mortality weakened, yet they continued to supply complementary signals about organ-system clustering that a single number does not. That is the second-order gain: risk magnitude from SMART, intervention geography from the clusters.
Genetic and Pathway Signatures Match the Clinical Labels
To test whether the clusters were statistical artefacts, the team ran Phenotype-Wide Association Studies and Reactome pathway enrichment. Each trajectory mapped to a different molecular signature.
ACUTE-CARD linked to immune activation and tissue remodelling. CARDIOMIX enriched for insulin signalling and lipid transport. SMO-CARD showed chronic inflammation and degeneration pathways. An earlier preprint methods and PheWAS details version of the work already pointed in the same direction before peer review tightened the numbers.
These biological anchors matter. They suggest the clusters reflect real disease processes rather than coding artefacts, opening a path from electronic-health-record phenotyping toward mechanism-guided trials or rehab packages.
The Smoking-Related Group Carries Clear Clinical Flags
SMO-CARD patients were older on average, lived in more deprived areas, and already carried respiratory codes before their heart attack. Once clustered they accumulated lung, musculoskeletal and multi-organ diagnoses at high rates. Five-year all-cause mortality reached 43.9 percent.
Key load-bearing figures from the final analysis:
- 12,701 UK Biobank participants with incident AMI
- 43.9 percent five-year mortality in SMO-CARD
- 0.906 AUC-ROC for trajectory assignment by XGBoost
- Three biologically distinct pathway signatures confirmed by PheWAS
Onoja’s public summary emphasised that hospitals could, in future, identify these patients early and offer tailored packages such as pulmonary rehabilitation and frailty support rather than a uniform secondary-prevention checklist.
Practical Uses Hospitals Can Test Now
The models run on data already sitting in most electronic records: prior diagnoses, age, sex and a deprivation index. No new imaging or lab panel is required for the first-pass assignment. Professor Nophar Geifman’s informatics group frames the output as a complement to existing scores, not a replacement.
Possible near-term steps include routing SMO-CARD-flagged patients to respiratory and frailty clinics sooner, intensifying rhythm monitoring for CARDIOMIX, and keeping ACUTE-CARD patients on standard cardiometabolic pathways while watching for episodic complications. Because the pathways differ, trialists could also stratify future post-MI drug or rehab studies by trajectory membership.
The authors stress the work is still early. External validation outside UK Biobank, prospective deployment studies, and clearer decision thresholds are required before any guideline change. Yet the combination of high predictive accuracy at the index event, complementary value over SMART, and biological corroboration already supplies a concrete template for mechanistic phenotyping after heart attack.
Frequently Asked Questions
What are the three multimorbidity trajectories after a heart attack?
ACUTE-CARD (63.4 percent) centres on cardiometabolic disease with episodic cardiorenal-respiratory events and the most favourable survival. CARDIOMIX (13.5 percent) features arrhythmias, structural heart disease and kidney problems. SMO-CARD (23.1 percent) is smoking-related multisystem decline with the highest mortality.
How accurately can the AI predict a patient’s trajectory at the time of the heart attack?
Using only pre-event diagnoses and demographics, XGBoost reached an AUC-ROC of 0.906 and CatBoost 0.900 for multiclass assignment to the three trajectories, according to the peer-reviewed JAMIA results.
Does the new tool replace the SMART risk score?
No. SMART remained the strongest single predictor of five-year mortality. The trajectories add complementary information about which organ systems are likely to accumulate disease and therefore where to direct extra interventions.
What biological evidence supports the three clusters?
Phenotype-wide association and pathway analyses linked ACUTE-CARD to immune activation and tissue remodelling, CARDIOMIX to insulin signalling and lipid transport, and SMO-CARD to chronic inflammation and degeneration pathways.
Which pre-event factors most strongly flag the highest-risk trajectory?
Respiratory conditions already present, older age and higher deprivation scores were the leading SHAP drivers for assignment to the smoking-related SMO-CARD group.
Disclaimer: This article is news reporting and analysis of a published research study for general information only. It does not constitute medical advice, diagnosis, treatment recommendations, or clinical decision support for any individual patient. Readers and clinicians should consult a qualified physician or cardiologist and review the original peer-reviewed paper before considering any change to care pathways or risk assessment. Figures, model performance and cluster definitions reflect the sources available as of the article date and may be revised by future validation studies.


South Korea Retail Investors Face Reckoning After KOSPI AI Rally Collapses

Surrey AI Maps Three Heart Attack Paths and Their Molecular Roots

Germany Locks Neutral Apple ATT Prompts Across Most of Europe

Apple’s 5% EU Fee Quietly Rewrites Alternative App Store Math

Apple’s EU Fee Truce Cuts Complexity but Leaves Rivals Fuming

Pixel 11 Pro Fold Trades Thinness for Durability and Seven-Year Stay

Mayo AI Flags HCM Obstruction From Everyday Ultrasound Videos

Indian Brands Quietly Scale Landmark Screens and Home Tech

Navin Vatsa Turns Grief Into a Lifetime of Quiet Seeing

Google Bets Pixel 11 Agentic AI Will Redefine Phones

Oracle Cuts 21,000 Jobs in a Year, Cites AI in 10-K Filing

Fable 5 and Mythos 5 Return as US Lifts Anthropic Export Controls

SpaceX’s Google Deal Turns a Rocket Company Into a Cloud Landlord

CD Projekt Red Co-CEO: Redemption Arc Isn’t Done, Witcher 4 in 2027

XPL Rallies 30% Ahead of Plasma One Card Tier Launch

Google Search Profiles Build a Follow Graph Inside Discover

DGO App Brings Rs 549 Mobile Pass for FIFA World Cup 2026 in Nepal

Moonshot AI Targets $30 Billion in China’s Fastest AI Funding Sprint

Oppo’s ColorOS 17 Eligibility List Leaves A-Series Buyers Behind

Microsoft Xbox Layoffs Start in July as Sharma Slams 3% Margin
-
 AI2 months ago
Oracle Cuts 21,000 Jobs in a Year, Cites AI in 10-K Filing
-
 AI2 months ago
Fable 5 and Mythos 5 Return as US Lifts Anthropic Export Controls
-
 AI2 months ago
SpaceX’s Google Deal Turns a Rocket Company Into a Cloud Landlord
-
 GAMING2 months ago
CD Projekt Red Co-CEO: Redemption Arc Isn’t Done, Witcher 4 in 2027
-
 CRYPTO2 months ago
XPL Rallies 30% Ahead of Plasma One Card Tier Launch
-
 NEWS2 months ago
Google Search Profiles Build a Follow Graph Inside Discover
-
 APPS2 months ago
DGO App Brings Rs 549 Mobile Pass for FIFA World Cup 2026 in Nepal
-
 AI2 months ago
Moonshot AI Targets $30 Billion in China’s Fastest AI Funding Sprint